Mapping the New Employee Experience
HR and senior management were interested in learning how to make employees feel valued, improve employee satisfaction, and increase retention and engagement. They approached our UX team to create a journey map outlining a new employee's experience — from recruiting through the first 90 days on the job.
Methodology
HR provided a list of 122 potential partipants — employees who had been hired within the past 6 months. We selected fifteen employees using a blind, random process, with an additional fifteen employees selected for a “backup” pool. The names and titles of employees were masked during the selection process. Employees were chosen based on four categories of demographics: job level, program, hire date, and location.
We contacted participants via email, and set up hour-long interviews conducted either in person or by phone. One of us facilitated the interview, while the other took notes.
The Team
It was a team of two — myself and a fellow UX designer — who recruited participants, wrote the interview script, conducted the interviews, synthesized the findings, and designed the journey map together. Our UX Director helped conduct a couple of interviews and provided guidance and feedback along the way.
Synthesis
We went through each interview, and organized participants' thoughts and sentiments by the questions asked during the interviews. We then color-coded them to indicate whether the sentiment was positive, negative, or neutral. We grouped the sentiments again to see which areas and themes trended positive, negative, or neutral.


Four personas emerged from the findings. Their paths differed through recruitment and hiring, but were unique in other ways.
The Journey Maps
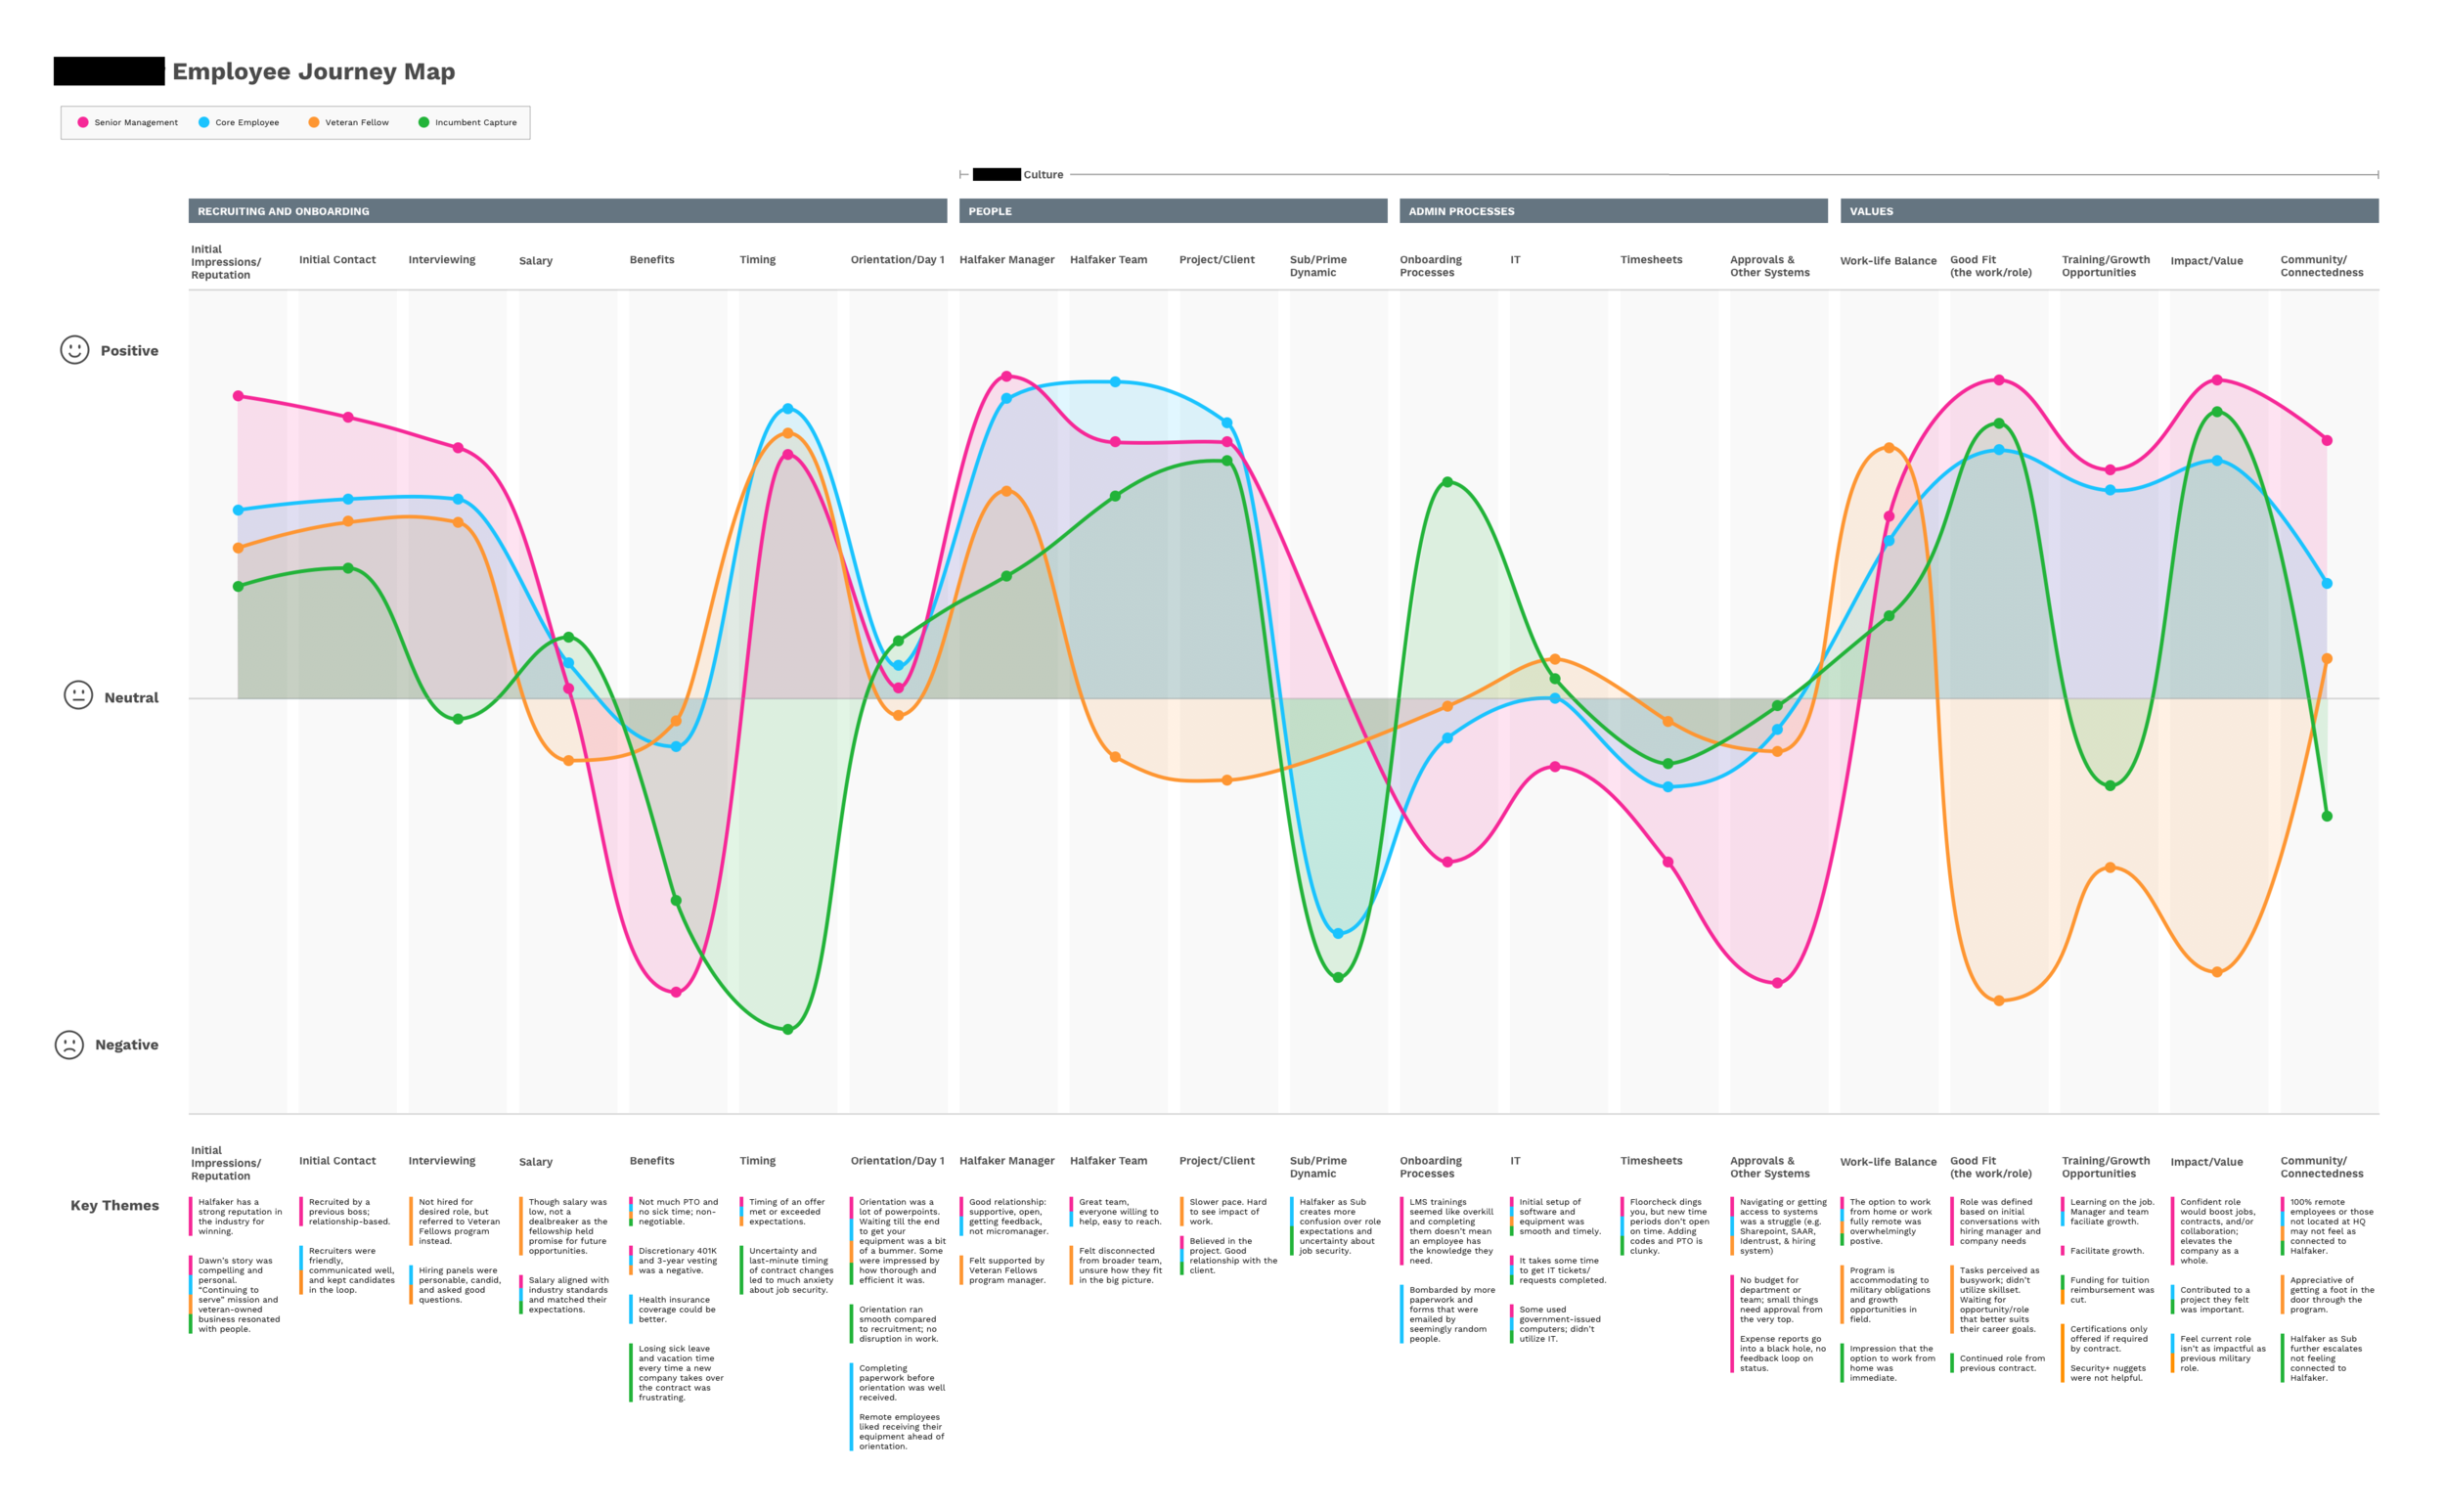
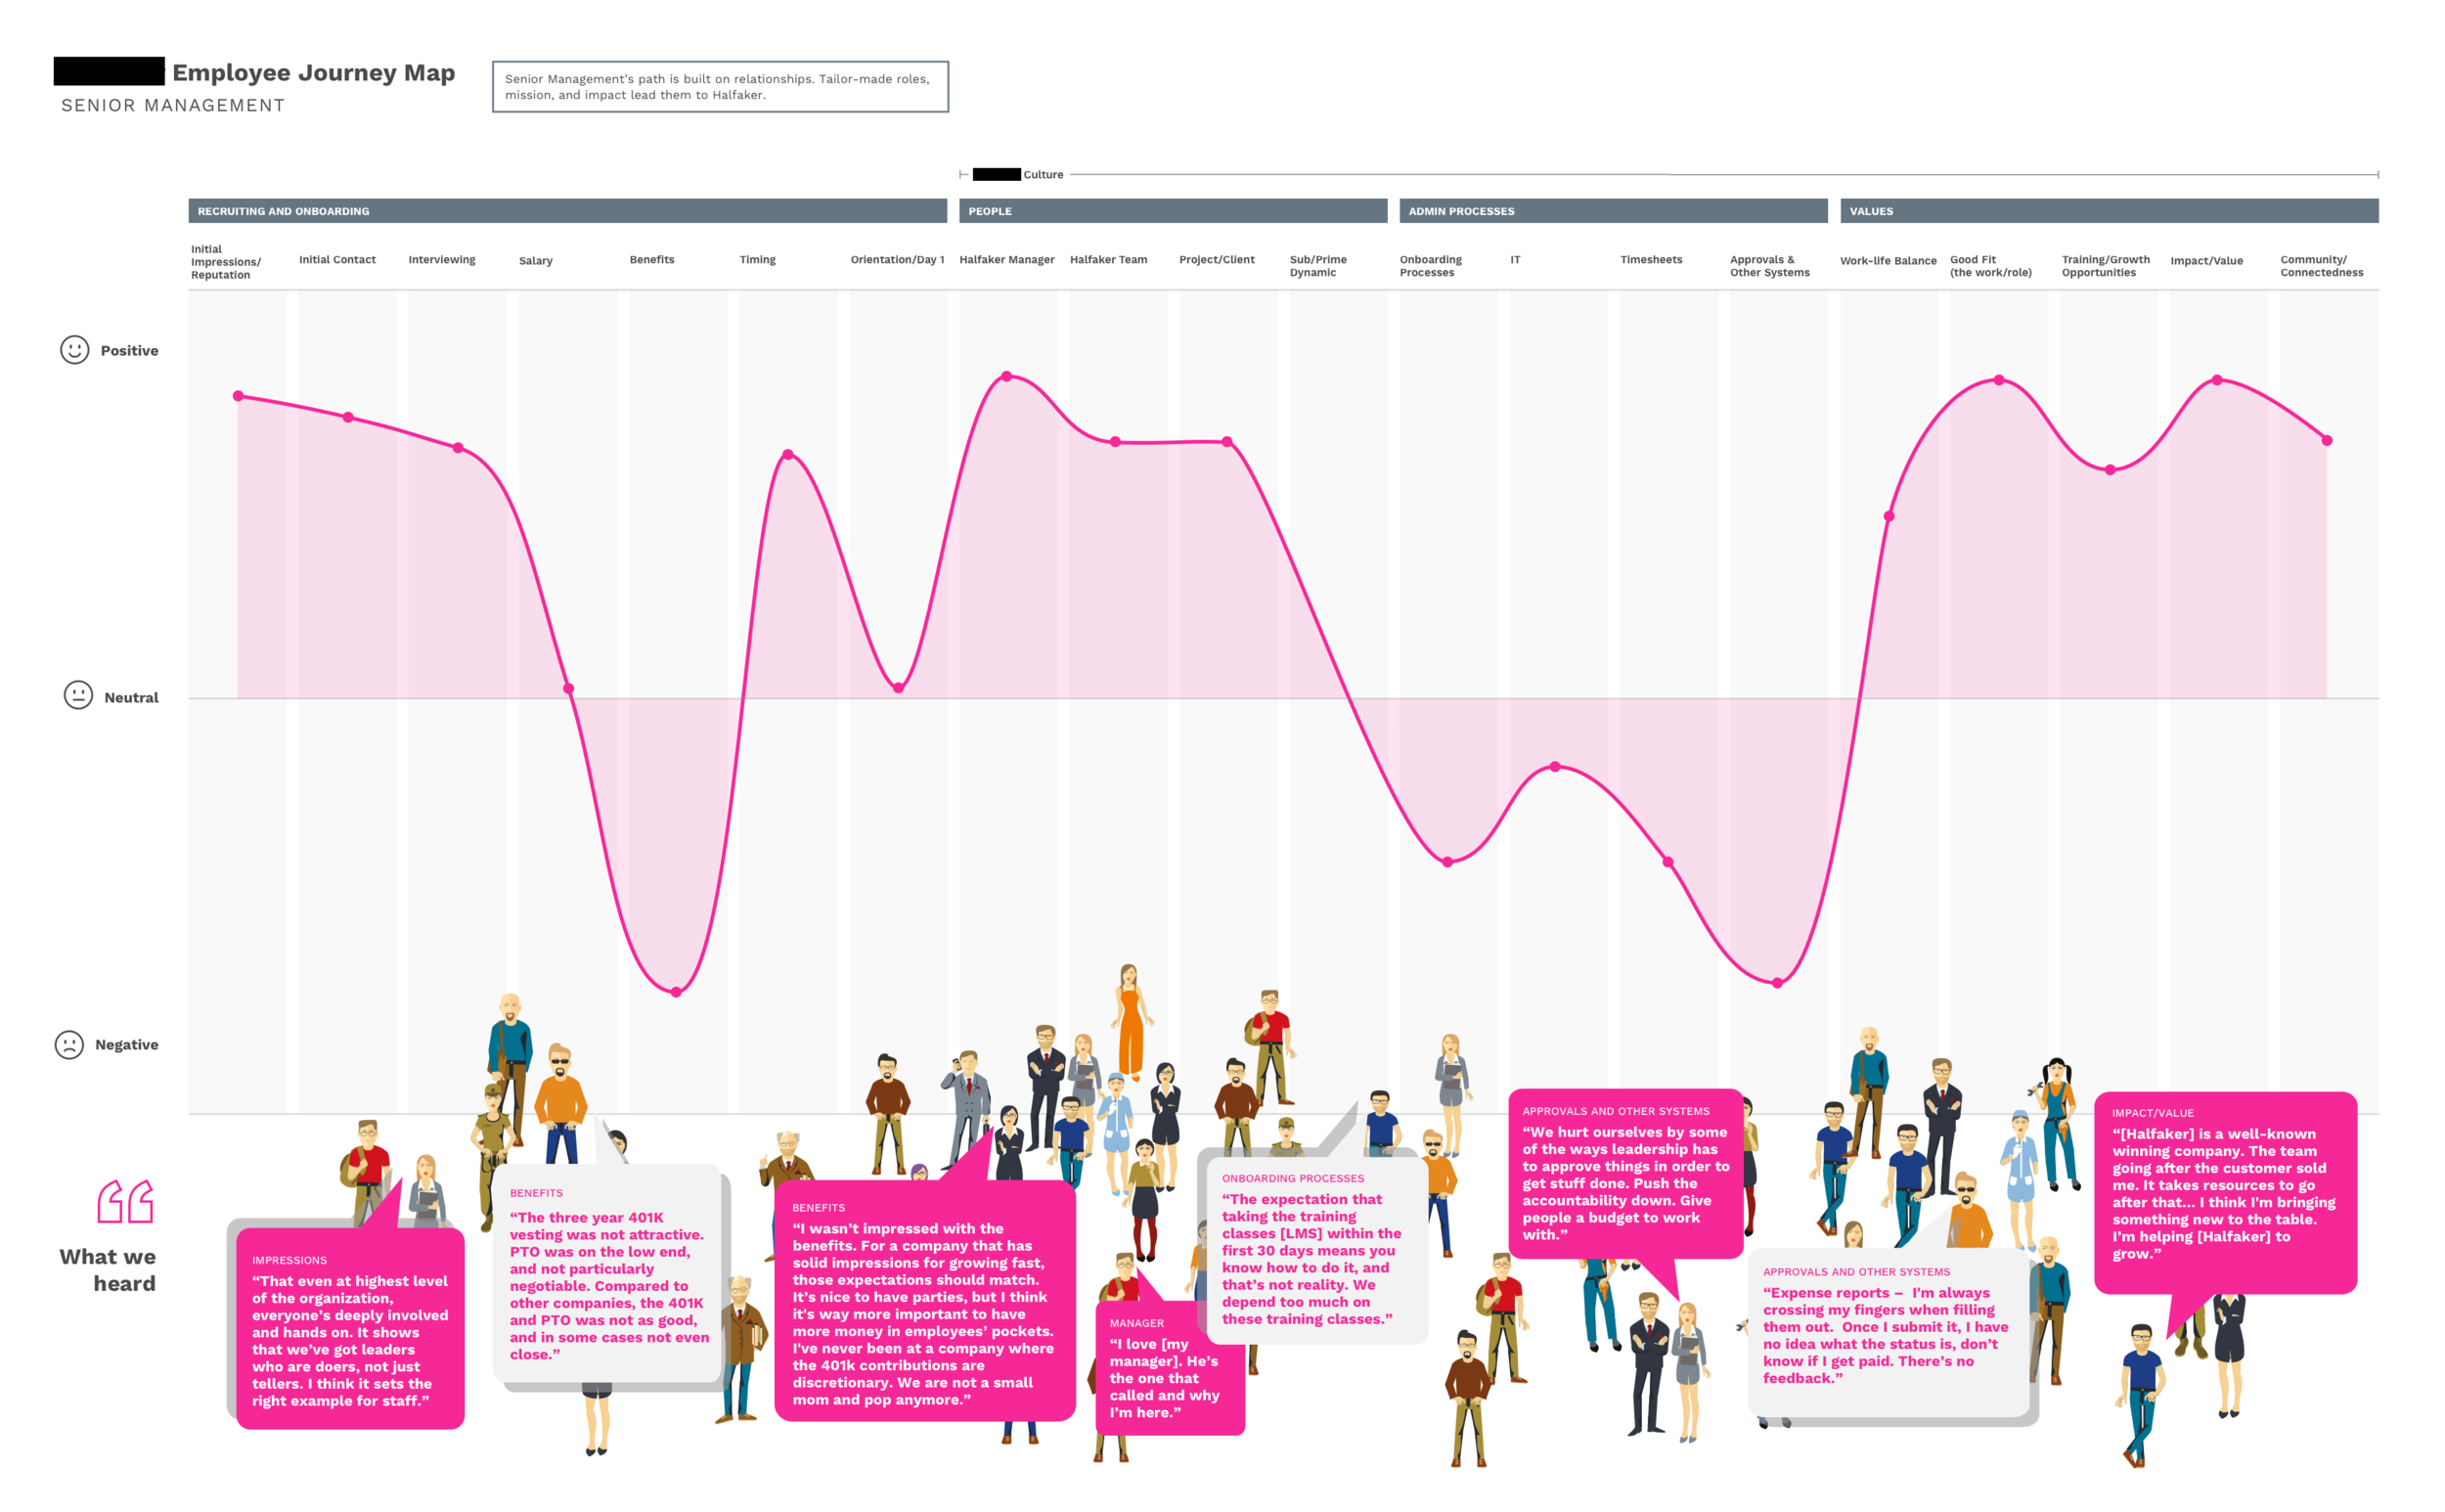
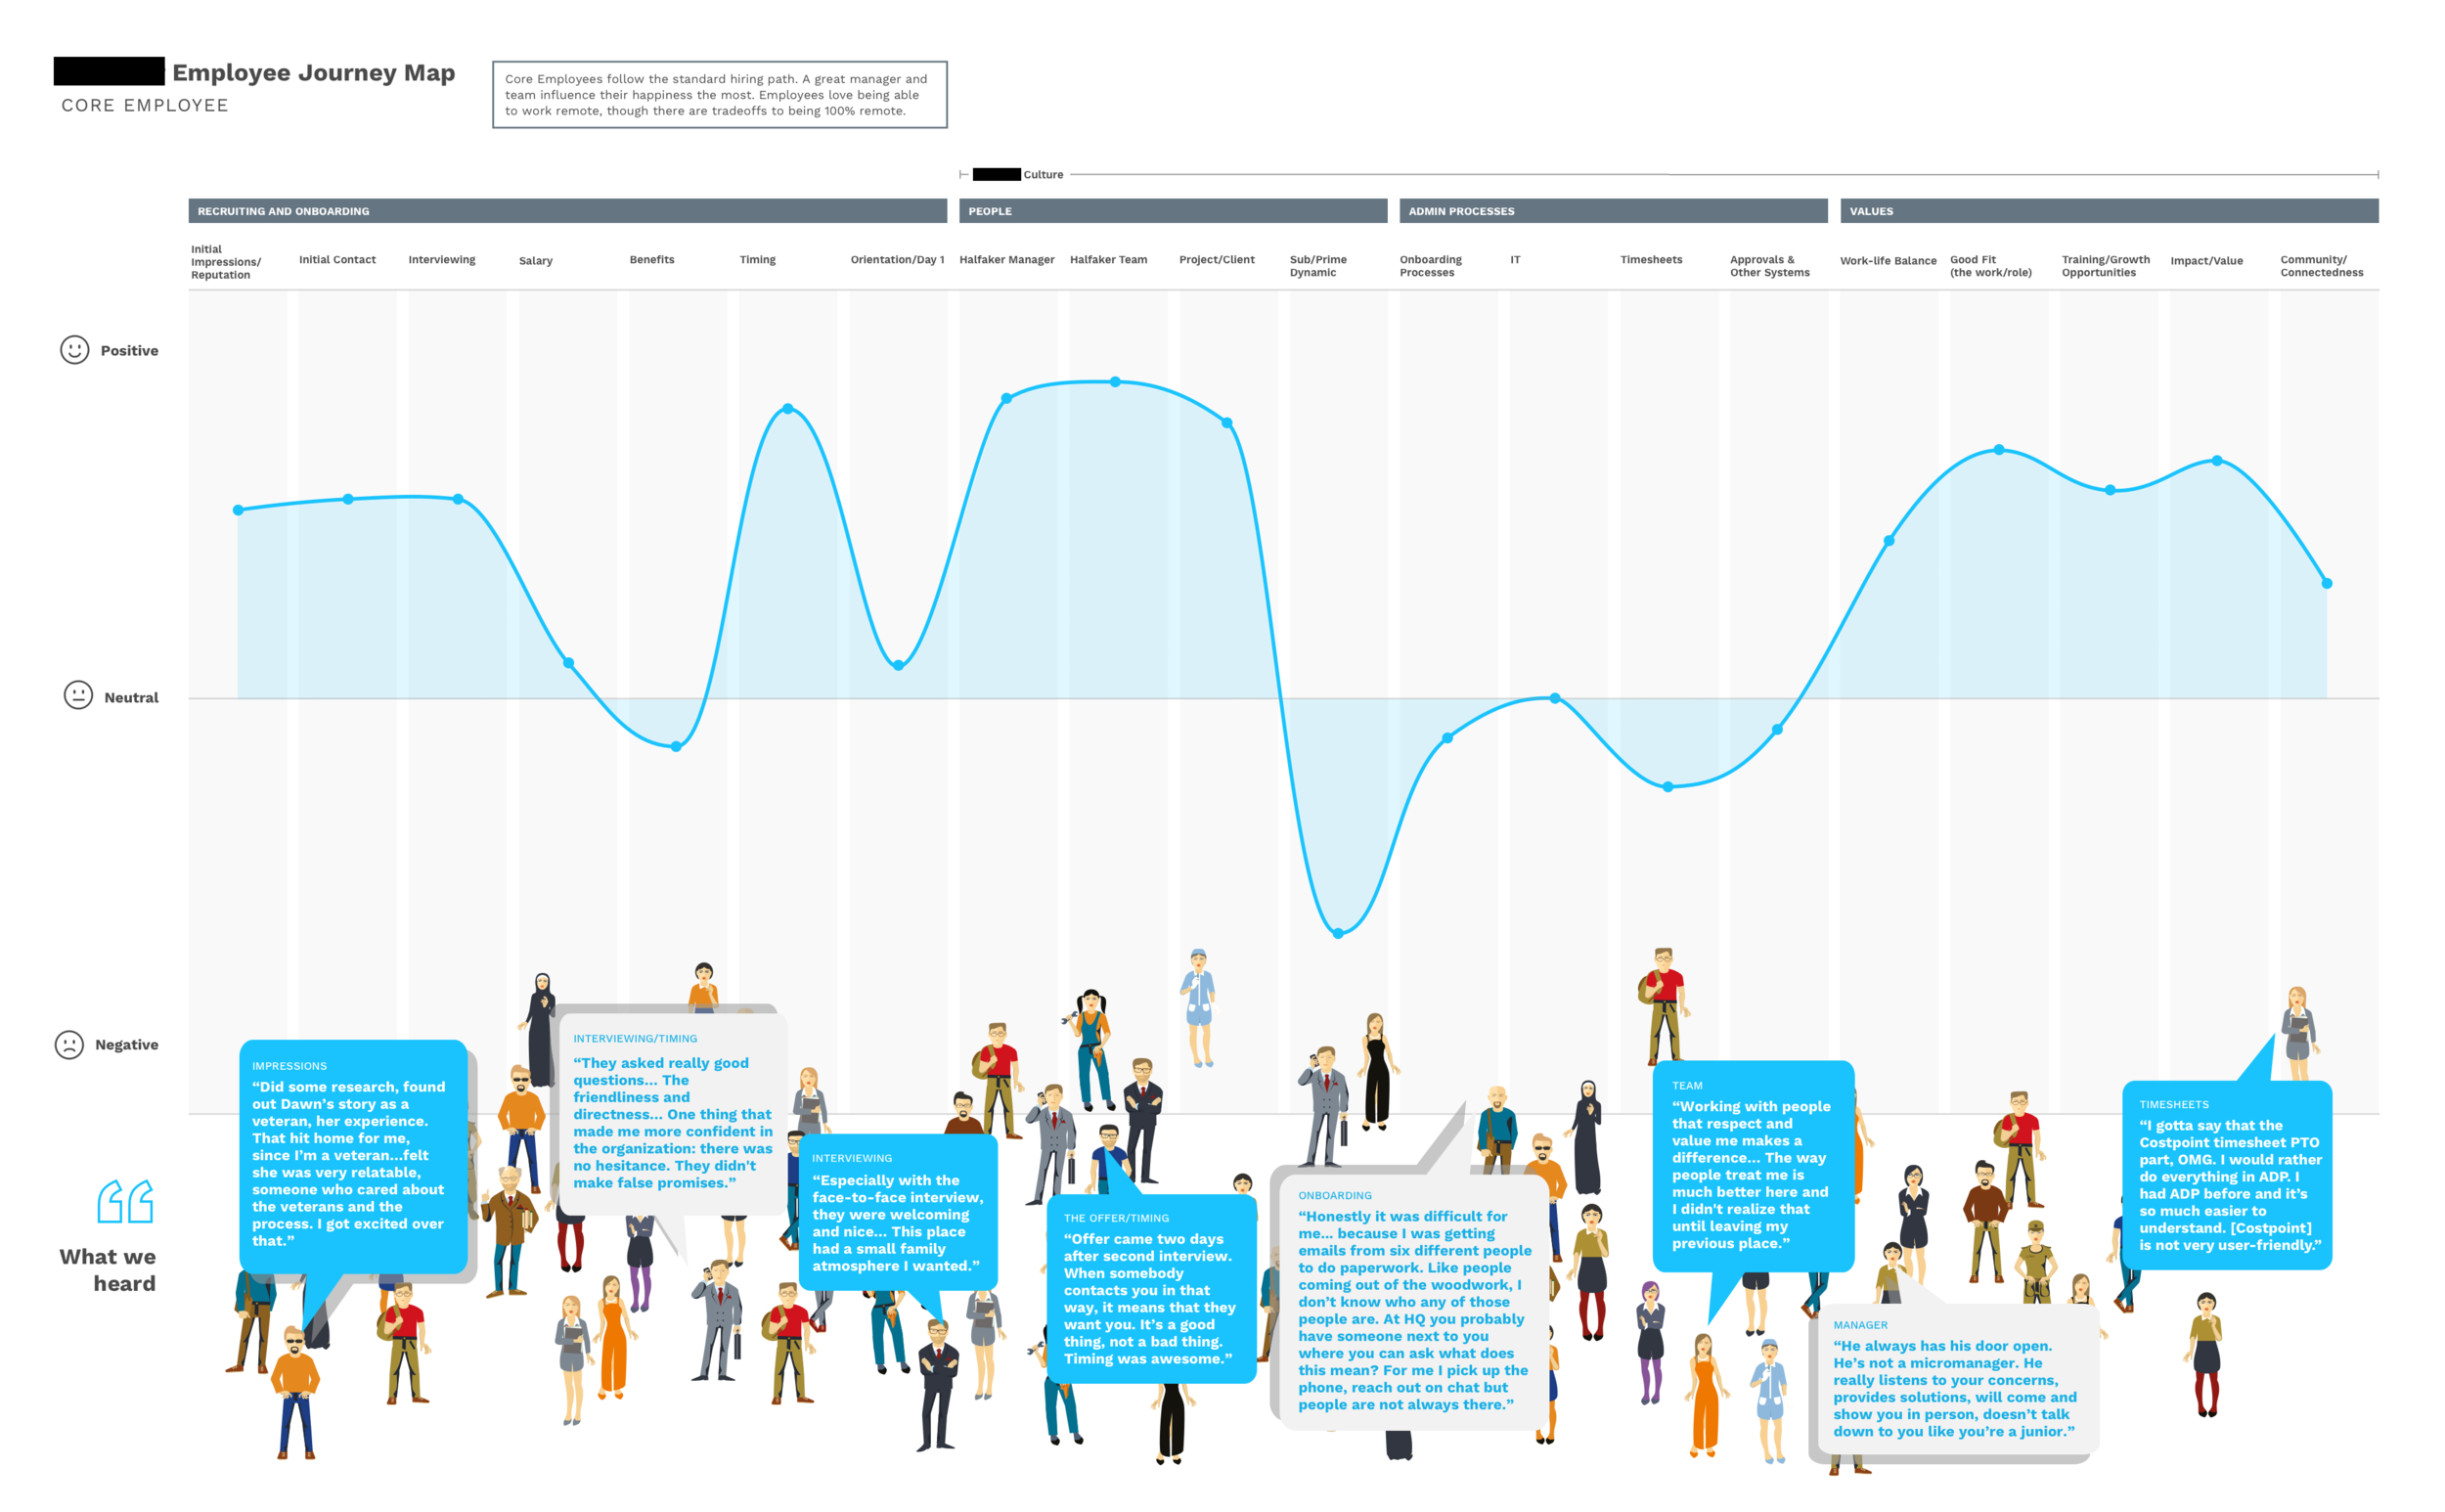
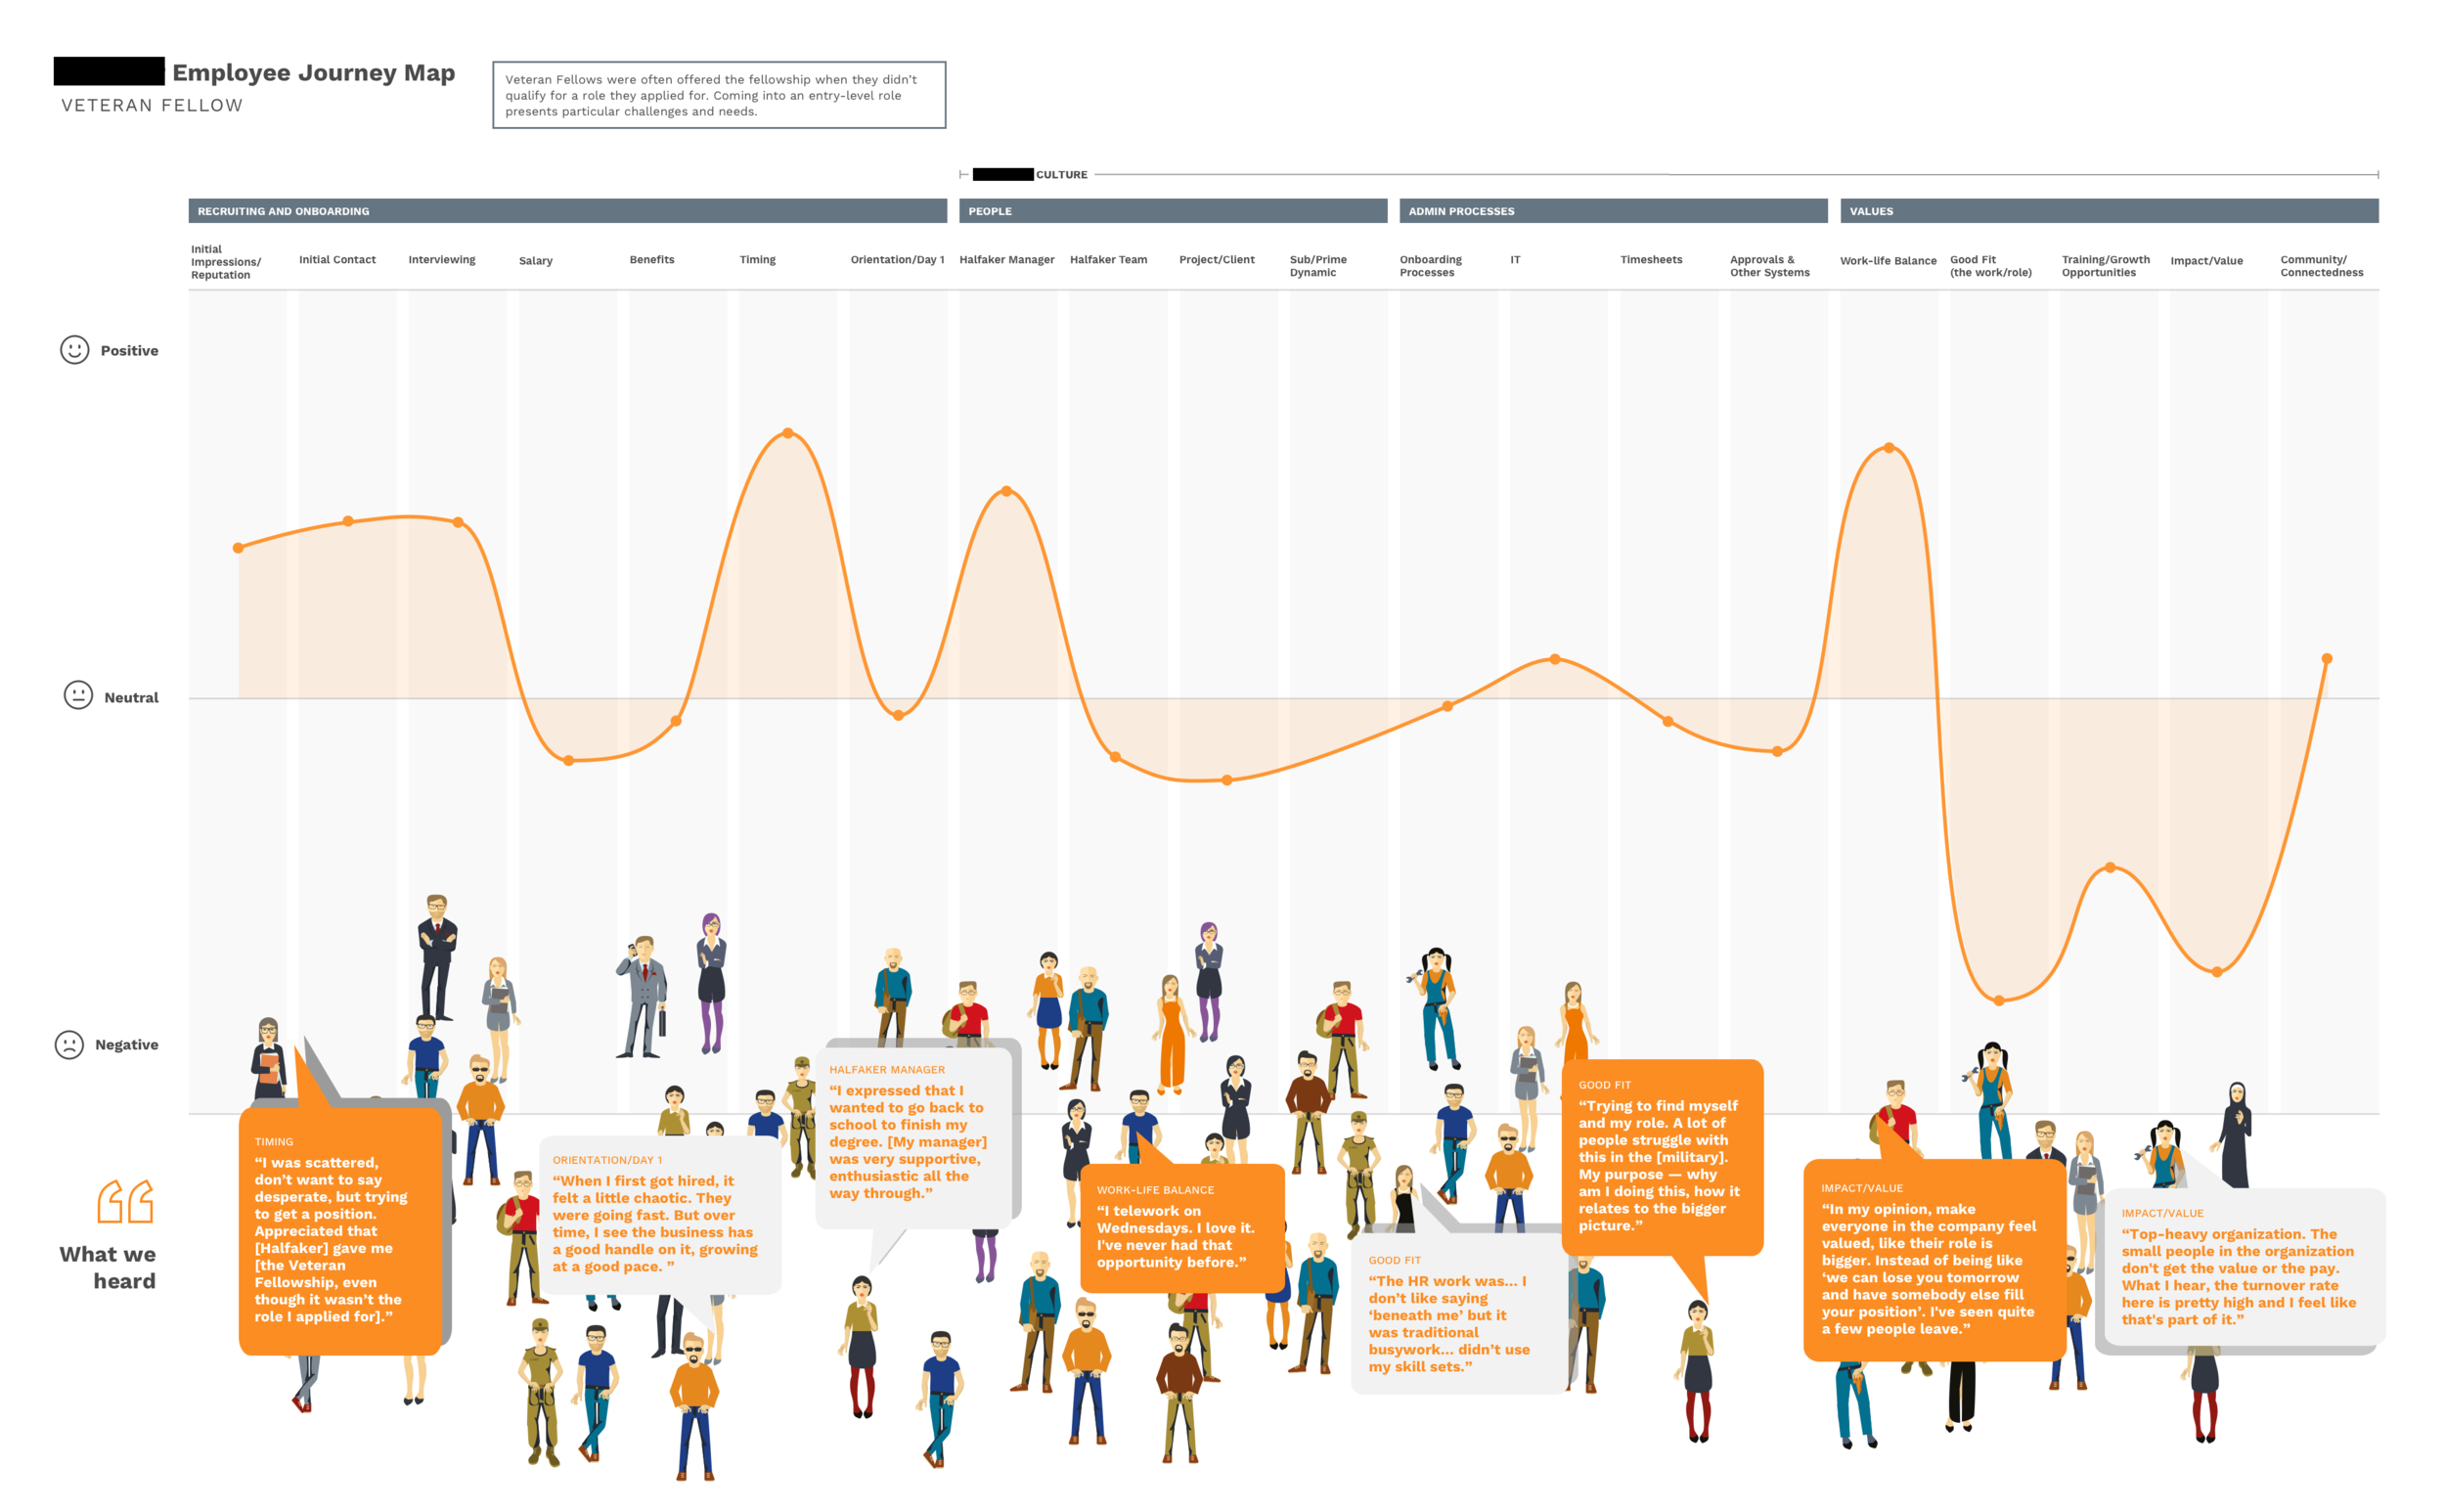
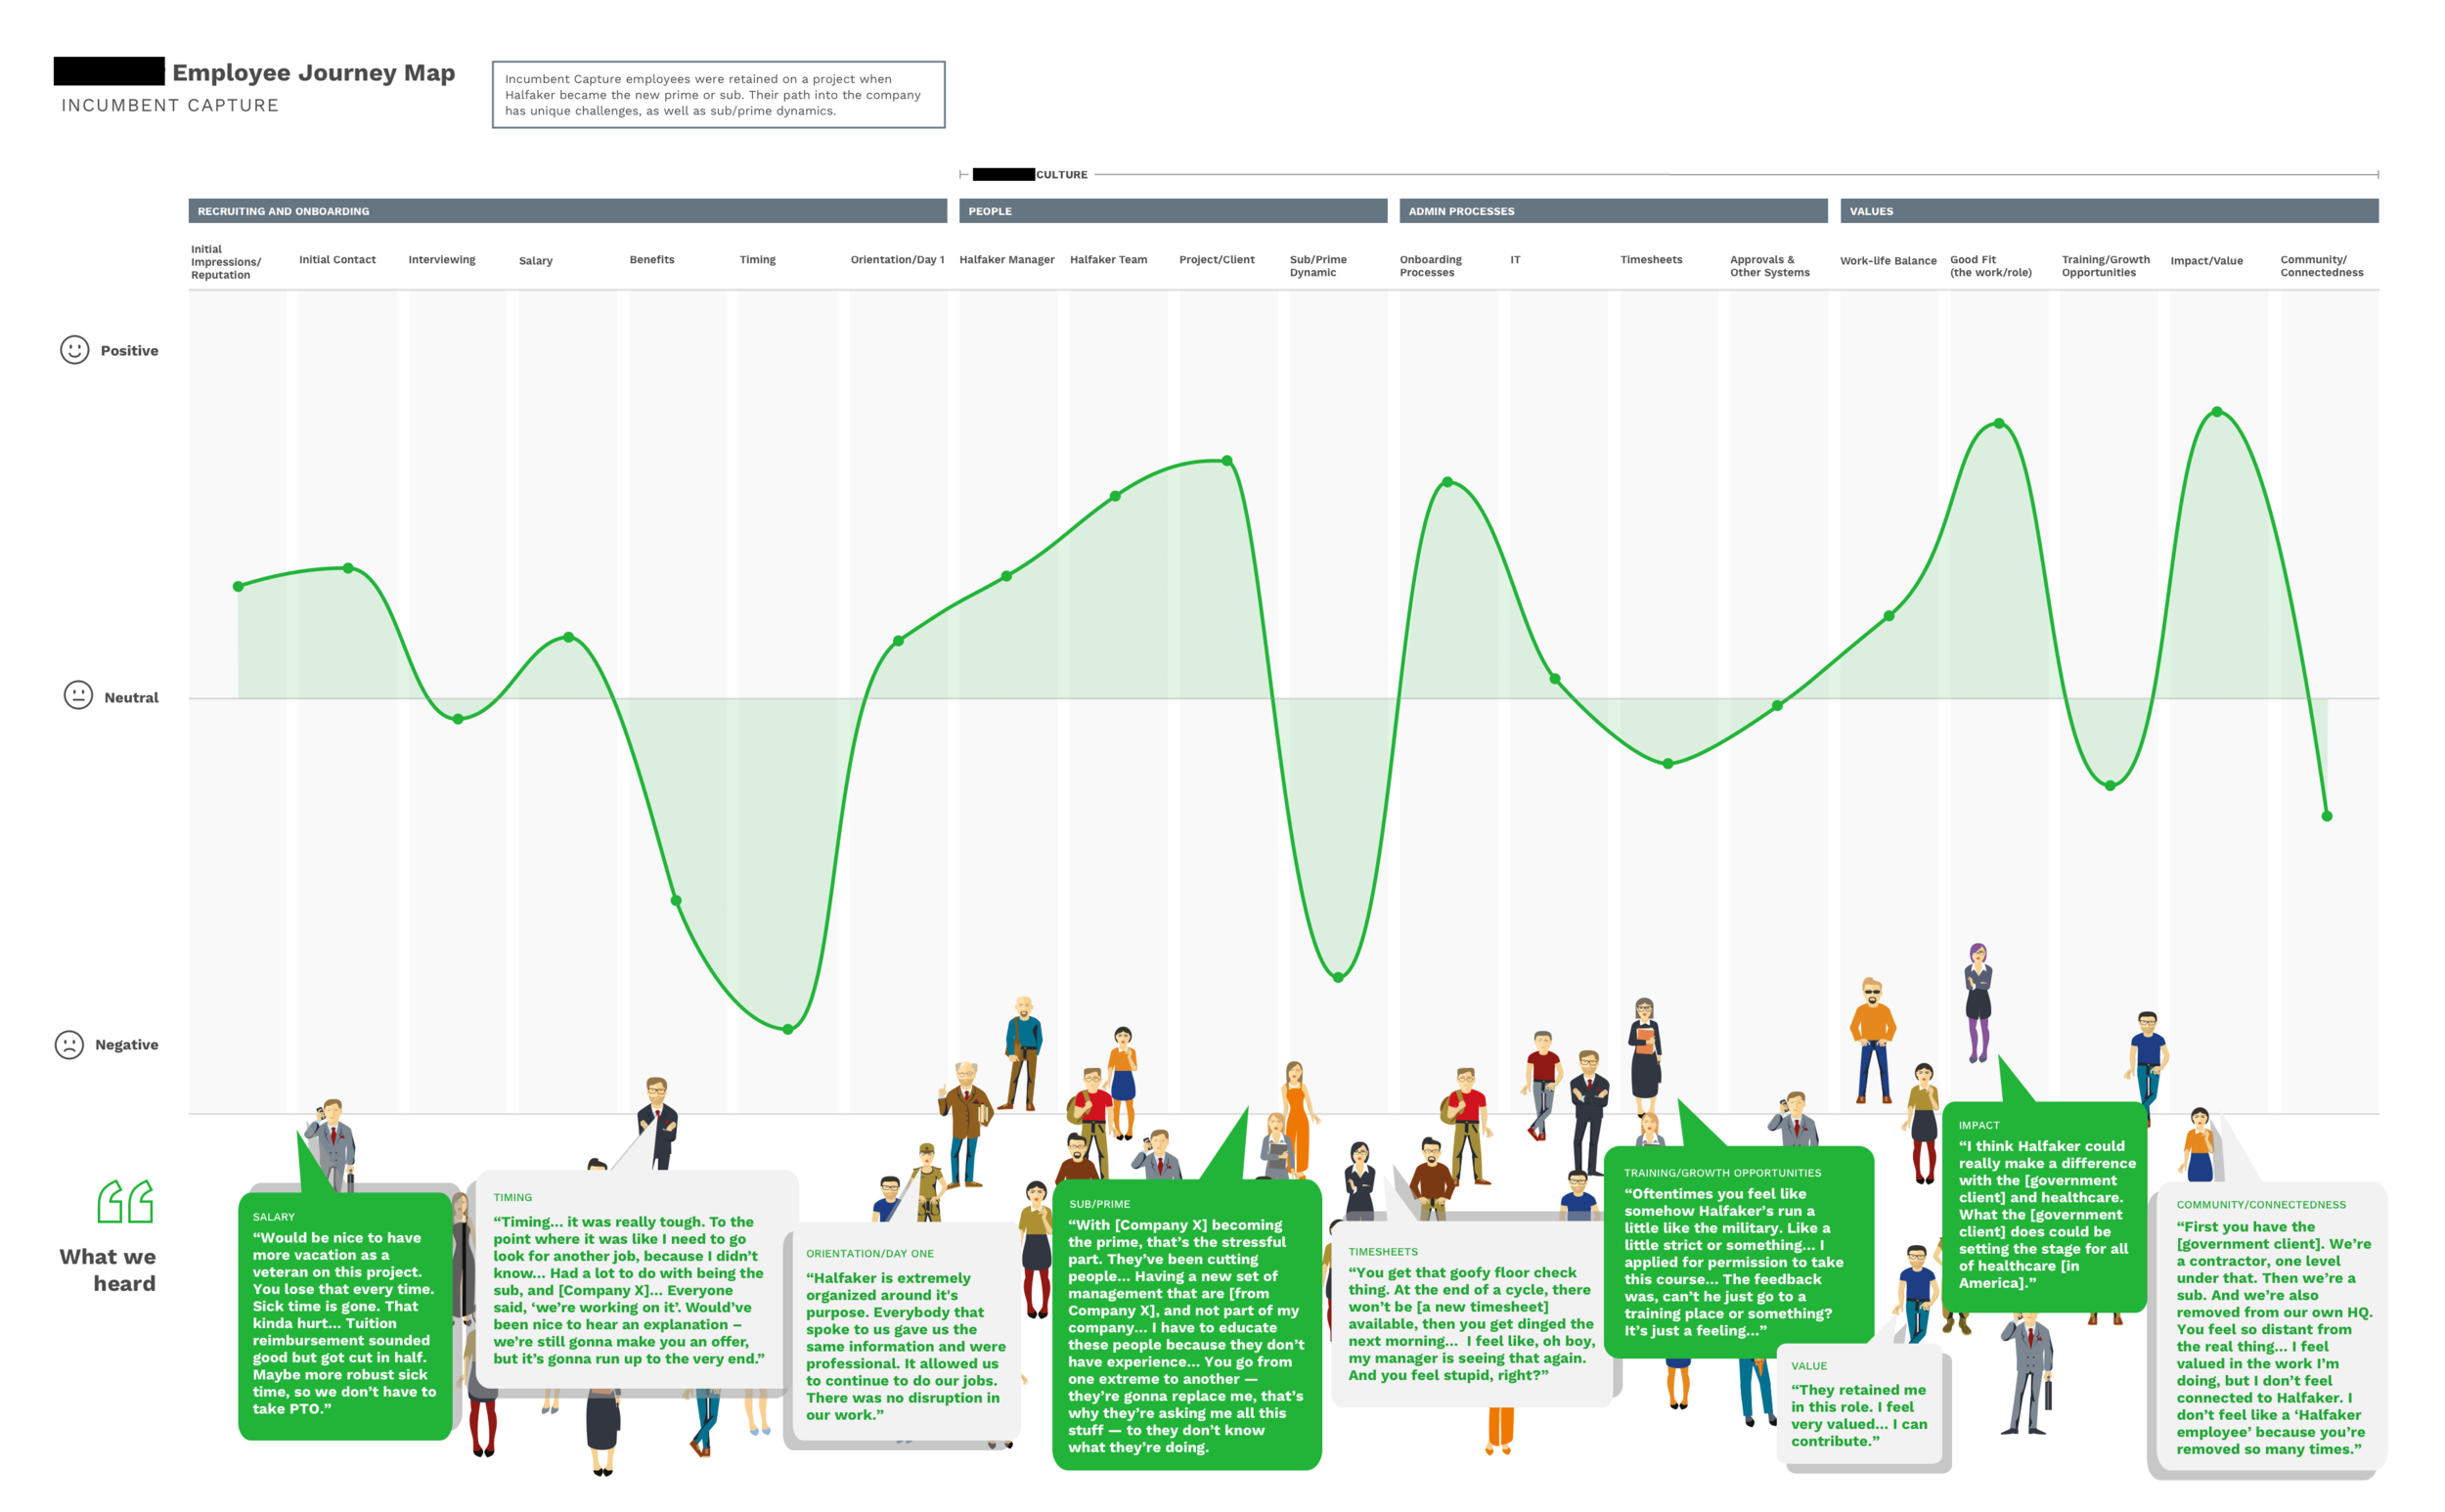
We developed five journey maps that depict employees’ sentiments on a positive/neutral/negative scale through the phases of recruitment and onboarding, as well as company culture. The categories under recruiting and onboarding share a linear timeline, but people, admin processes, and values reflect ongoing experiences with company culture.
The first map is a combined view of all the personas to showcase their similarities and differences. Key themes appear at the bottom, to highlight recurring sentiments in each category. The colored bar to the left of the text reflects which persona(s) expressed each sentiment. The remaining four journey maps are focused on each individual persona, and include representative quotes from the interviews.
We also summarized takeaways and opportunities in a report for leadership, and presented the findings to them.
Outcomes and next steps
- Company leadership were receptive to the findings. Our executive sponsor shared out the findings with the C-suite.
- Though leadership was originally focused on the initial onboarding experience, we learned that other factors had larger impacts on employees' experiences.
- The four personas had some similarities in their experiences, but also had very unique pain points based on their path into the company.
- If a follow-up study were feasible, we would continue following these participants' experience to see how things evolve over time.
- We'd like to expand the participant pool to interview employees who've been with the company for 6 months to a year, and beyond, to learn about their experiences.
- Are there inflection points or triggers that influence retention and turnover further along an employee's path?
- When are those critical moments, and what are opportunities the company can pursue?